Scaling an LLM app: rate limits, queues and backpressure
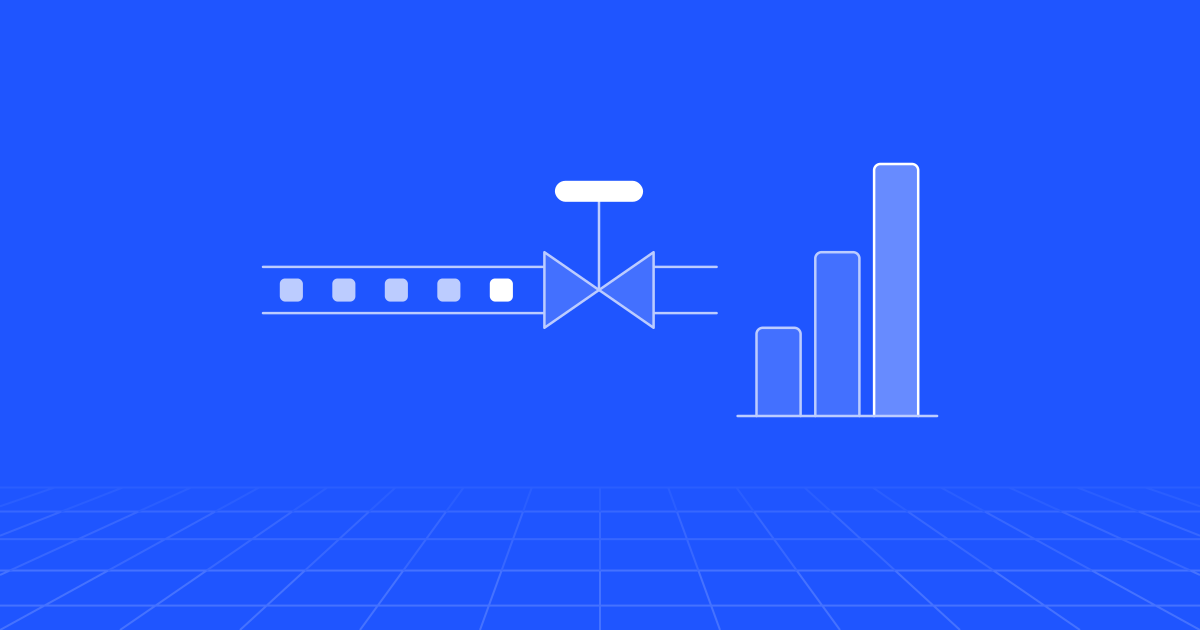
At ten users an LLM application is limited by your own code. At ten thousand it is limited by the provider’s rate limits and by how you behave when you reach them. Scaling means measuring demand in tokens per minute, putting a queue and a concurrency cap between users and the model, caching what repeats, retrying with jitter, and deciding in advance what to degrade or drop when capacity runs out.
What changes between ten users and ten thousand
With ten users, every call goes straight to the provider and comes back. Nobody thinks about limits, because nobody is near them. Latency is whatever the model takes.
With ten thousand, three things change. Demand is large enough to reach limits that the provider sets per minute, so some calls will be refused. Traffic has a shape, with a Monday-morning peak well above the average. And failures stop being independent: when the provider slows down, every user is affected at once, their retries pile on, and a brief wobble becomes an outage of your own making.
Take a helpdesk product with an AI assistant used by 10,000 support agents. Each request carries about 6,000 input tokens (instructions, tool definitions, retrieved articles and the conversation) and returns about 400. If 5 per cent of users send one request in the same minute, that is 500 requests, 3 million input tokens and 200,000 output tokens in that minute. The request count looks modest. The token count is what the limits will notice.
How do provider rate limits work?
The main providers all cap requests and tokens per minute for each model, and the caps depend on your account.
- Anthropic measures requests, input tokens and output tokens per minute for each model class at organisation level, with limits set by usage tier. It uses a token bucket, so capacity refills continuously instead of resetting on the minute, and a burst inside a few seconds can be refused even when the minute’s total is within bounds. A separate ramp limit can refuse a sharp jump in usage below your ceiling.
- OpenAI measures requests and tokens per minute, and per day for some models, at organisation and project level. Whichever limit is reached first applies, and some model families share one pool.
- Google’s Gemini API measures requests per minute, input tokens per minute and requests per day for each project, not for each API key.
All three return HTTP 429 when a limit is exceeded and raise limits as an account’s spending history grows. Anthropic and OpenAI report the remaining allowance in response headers. Anthropic and Google both state that the figures are ceilings, not guarantees.
We do not quote numbers here, because they differ by account and change often. Read yours from the provider’s console, then work out which limit you will meet first.
| Workload shape | Limit you reach first |
|---|---|
| Many short calls, such as classification or routing | Requests per minute |
| Retrieval with long context | Input tokens per minute |
| Long generated documents or code | Output tokens per minute |
| A new account or a low tier | Daily caps and spend limits |
The details are worth reading. Anthropic does not count tokens read from its prompt cache towards the input limit, so in the helpdesk example caching the 4,000 tokens that never change cuts the counted input from 3 million to 1 million a minute. OpenAI’s estimate takes max_tokens into account, so an inflated value reserves capacity you never use.
Getting more capacity: tiers, routes and commitments
More keys do not help. Limits belong to the organisation or project, so ten keys share one allowance. Separate projects or workspaces are useful for partitioning instead: give the nightly batch job its own workspace with a lower cap, and it cannot starve production.
Ask early. Higher tiers come with spending history, and increases beyond them go through a request form or a sales conversation. Start weeks before a launch.
Add a second route. The same model families are sold through cloud platforms such as Amazon Bedrock, Google Cloud and Microsoft Foundry, each with its own quota. A second provider adds independence from one company’s bad day. Both count only if you test them. Prompts behave differently across models, and a fallback that has never taken production traffic is a hope, not a plan. Getting a prompt to hold up on two models is ordinary LLM engineering, and it has to be done before the outage. Run a small share of real traffic through the second route all the time.
Buy a commitment when traffic is steady. What is on offer has shifted, so check before you plan:
- Microsoft Foundry sells provisioned throughput in units billed by the hour or reserved for a month or a year, with optional spillover to a pay-per-token deployment when the reserved capacity is full.
- Amazon Bedrock has four service tiers: Reserved capacity for one or three months that overflows to Standard, a Priority tier at a premium per token with no reservation, Standard, and a discounted Flex tier for work that can wait.
- Google Cloud sells Provisioned Throughput as a fixed-term subscription for named models and locations.
- OpenAI offers a faster tier at a premium and a cheaper flex tier, chosen per request.
- Anthropic’s documentation says Priority Tier commitments are no longer sold and directs customers who need guaranteed capacity to its sales team.
The pattern across providers is three grades of service: reserved, standard and deferred. Put the steady interactive baseline on reserved capacity if you can forecast it, let peaks overflow to standard, and send everything that can wait to flex or batch pricing. The cost side of that decision is in FinOps for AI.
Queues, priorities and concurrency control
Route every model call through one client module or gateway. If calls are scattered across the codebase, nothing knows the total and nothing can slow it down.
That layer needs three controls.
A token-aware limiter. Keep one bucket for requests and one for tokens for each model, shared by all instances in a store such as Redis. Estimate input tokens before sending, reserve the expected output, and correct the estimate from the usage figures and rate-limit headers that come back. Set your own ceiling a little below the provider’s, so that you throttle yourself smoothly before the provider does it abruptly.
A concurrency cap. Requests in flight equal arrival rate multiplied by latency. At 500 requests a minute and eight seconds each, about 67 are in flight at once. When the provider slows to sixteen seconds, the same traffic needs twice as many, and without a cap your connection pools and memory find that out for you.
Priority queues. Interactive requests wait in a short queue with a deadline of a few seconds. Background work waits in a durable queue for as long as it needs. When the token budget is tight, bulk jobs yield first. Add a per-tenant limit beneath the global one, so that a single customer’s import cannot spend everyone’s allowance.
Moving slow calls out of the request path altogether is the larger design change, and we describe it in event-driven architecture for AI workloads.
Caching and streaming
The cheapest request is one the model never has to read in full.
Prompt caching. Providers cache the unchanging start of a prompt and charge much less to read it back. Order prompts so that the stable parts come first (instructions, tool definitions, reference documents) and the volatile parts last. Anthropic’s cache lasts five minutes by default and is refreshed on each use, so scale works in your favour: at ten users the cache expires between requests, and at ten thousand it never goes cold.
Response caching. Cache whole answers for identical requests, keyed on the normalised question and the version of the context behind it. Be careful with semantic caches that match similar questions, because similar is not the same. Always scope cache keys by tenant and by the user’s permissions.
Precomputing. A summary generated when a ticket is updated costs one call. The same summary generated every time someone opens the ticket costs hundreds.
Streaming does not reduce tokens. It changes how waiting feels, and it stops a long response looking like a dead connection. It has costs of its own. Every stream holds a connection open for its full length, and an error can arrive mid-stream after the status line has reported success. Measure time to first token separately from total time, because users judge the first and capacity depends on the second.
Timeouts, retries and load shedding
Timeouts
Set timeouts from measured latency percentiles, not from round numbers. For streams, use a short limit on time to first token and a longer one on total duration. Pass the deadline down the stack and cancel the upstream call when the user has gone, because a generation nobody is reading still costs tokens until it is stopped.
Retries with jitter
Amazon’s engineers call retries “selfish”: the client spends more of the server’s time to improve its own odds. That is fine for an isolated failure and harmful when the server is failing because it is overloaded.
- Retry only what can succeed on a second attempt: 429, overload and server errors, dropped connections.
- Treat
retry-afteras the minimum wait. Beyond it, back off exponentially with random jitter, so that a thousand workers do not all return in the same second. - Cap both the number of attempts and the total time.
- Retry at one layer only. If the SDK retries, your wrapper retries and the queue redelivers, three attempts at each of three layers make 27 calls for one request. Anthropic’s SDK retries twice by default, so either rely on that or turn it off.
- Add a circuit breaker. When a model’s error rate passes a threshold, stop sending for a short period and use the fallback.
delay = min(cap, base * 2 ** attempt)
time.sleep(max(retry_after, random.uniform(0, delay)))
Load shedding and graceful degradation
When demand exceeds capacity, a queue only postpones the problem. Bound waiting by time: a request that has waited longer than the user will stay is wasted work, and serving it delays someone who is still there. Then decide, in advance, what the user gets instead.
- A cached answer, marked as possibly out of date.
- A smaller, faster model, with a prompt that has been tested on it.
- A shorter job: fewer retrieved documents and a lower output limit.
- A deferral: the work is queued and the user is told when to expect it.
- An honest refusal with a time to try again.
Shed the lowest priority first, so that bulk jobs and free plans give way before paying interactive users. Test every rung before you need it. A smaller model that has never been evaluated on your task is a different product, and users should be told when they are getting it.
Load testing and the dashboards to watch
A load test that sends “hello” a thousand times measures nothing useful, because limits and latency both scale with tokens.
- Replay a sample of real prompts, anonymised, with the real spread of lengths and the real arrival pattern, bursts included.
- Test your own queueing against a stub that enforces request and token limits, returns 429 with
retry-afterand has realistic latency. It is free and repeatable. - Then run a smaller test against the real provider, in a separate project or workspace so that it cannot throttle production. Ramp up gradually, since a sudden jump can trip ramp limits.
- Test the failure cases: the provider at double latency, the provider refusing half of all calls, the fallback route alone.
On the dashboard, for each model and route:
| Signal | Why it matters |
|---|---|
| Input and output tokens per minute against the limit | Headroom before refusals start |
| 429 and overload rate | Whether you are being throttled now |
| Time to first token and total latency, 50th and 95th percentile | What users feel, and what concurrency depends on |
| Age of the oldest queued request, by priority | Backpressure, visible earlier than any error |
| Retries per request, fallback rate, degraded-response rate | How often the safety nets are in use |
| Cache hit rate | Throughput and cost you are getting for free |
| Tokens and cost by tenant | Who is consuming the allowance |
These sit beside the quality and versioning measures in LLMOps in production.
Where to start
In the first week:
- Export a week of usage. Work out peak requests, input tokens and output tokens per minute for each model, and compare them with the limits in your console.
- Send every call through one client with a timeout, single-layer retries with jitter, and metrics.
- Reorder prompts for caching and measure the hit rate.
- Give background work its own queue, its own project or workspace, and a cap.
- Write down the degradation ladder and test one rung of it.
The first decision is whether your expected peak fits within today’s limits with room to double. If it does not, open the conversation with your provider now, because it has the longest lead time of anything on this list. Capacity planning, gateways and monitoring for LLM systems are part of our cloud and DevOps work.